Hive Mind: How Your Nation’s IQ Matters So Much More Than Your Own - Garett Jones 2016
A da Vinci Effect for Nations
MOST OF US WOULD WILLINGLY PLACE A $20 BET that the average classroom in East Asia will outperform the average classroom in South America on the vast majority of math tests. Maybe that will change in the next few decades—due to shifts in education, public health, or other factors. As of today, however, it’s a pretty safe bet.
But can the same cognitive test, given in different countries, actually predict something more substantial, such as intelligence, mental alertness, or quickness? Posing an even larger question, do these allegedly narrow measures of test-taking ability predict real-world economic outcomes in different countries? In other words, can an IQ test, designed by American academics, help to predict which villagers earn more in rural Pakistan? Can IQ tests be fair in the diverse world we inhabit?
Let’s consider how a fair IQ test might show that one nation currently has a higher average IQ score than another. Nation X might have better childhood nutrition than Nation Y, which causes Nation X to have taller, healthier children. And since the brain is a part of the human body, healthier children will tend to have better-functioning brains. If you had fair IQ tests—perhaps the Raven’s pattern-finding test, which isn’t language-bound—and administered it to typical children in both countries, you’d find that Nation X’s students usually did better. The same traits that make the students in Nation X taller on average also make them smarter on average. And we’d expect that as Nation X’s students grew up, they’d become more productive, higher-paid workers, able to think a bit more quickly on the job.
Now let’s consider another scenario, the case of Nations P and Q. In Nation P, the students are given a test in their own language, by a psychologist who speaks it. In Nation Q, the students are given an IQ test in a language they only use about half the time—perhaps just at school—by a psychologist who barely speaks any of the country’s languages; he’s a graduate student who just flew in to give the tests and then he’ll fly home. It would be no surprise if the students in Nation P did better on average than the students in Q: students in Q would barely understand the graduate student’s instructions, and the test’s translation would be awful. Even the best students would be grasping at straws to try to understand what the test was all about.
The P and Q example is an obvious case of test bias.1 But it’s not the difference in test scores that makes the test unfair for students in Nation Q: what makes the test unfair is that it wouldn’t work. In Nation Q there would be a weaker relationship between test scores and student performance in real-world settings. The Q test scores would contain far more noise than the P test scores. Yes, the brightest students in the Q sample would be a bit more likely to figure out the meanings of the poorly translated test, but IQ tests are not foreign language tests. The results of a test given by a poorly trained graduate student who doesn’t understand the local culture would be about as valuable as a medical exam written by someone who took half a semester of human anatomy.
But language and competent test administration aren’t the only possible problems. There are surely cultural barriers to testing average cognitive skills across countries. If we’re comparing test scores across countries, we want to be sure that the tests aren’t systematically harder in Nation Q than in Nation P. Some questions on an IQ test just won’t be good questions in certain cultures. For instance, one part of the Wechsler IQ test is a picture completion test, in which you look at a picture and decide what is missing. Examples from old, outdated tests include “Two people playing tennis on a court lacking a net, or a man in a bowling alley but with no ball in his hand . . .”2 Those aren’t reasonable test questions for people who’ve never seen a tennis court or a bowling alley. Of course, these are obvious examples, and these basic objections have been known to decades of psychologists: hence the long-standing psychological research project of creating tests that were “culture fair” or “culture reduced.”
So we can’t just assume that differences in average test scores are the same as differences in average mental skills. People might have genuinely useful skills, skills that are useful in the marketplace and in government, but skills that can’t show up on unfair tests. At the same time, differences in test scores across countries might well reflect differences in skills that modern markets and modern governments genuinely value. After all, if we’re interested in predicting success in the modern economy, at predicting the ability to analyze and use information as it exists from Japan to Italy to the United Kingdom, we’d want a test that picks up differences in the broad mental skills actually useful in these societies.
Perhaps people are all equally skilled in some unmeasurable way that doesn’t show up on any standardized test and that doesn’t show up in modern life outcomes. If so, perhaps future research can measure that form of deep equality. But we’re interested in finding something more down to earth: standardized tests—math tests, reading tests, IQ tests—that can detect any differences that might exist across countries in the current average level of practical mental skills. It appears that tests like this actually exist.
IQ Scores Across Countries: Where Do They Come From?
For decades, psychologists, economists, and public health researchers have been administering IQ tests around the world and reporting the results in academic journals. But there was no systematic effort to collect and compare these scores across countries until psychologist Richard Lynn and political scientist Tatu Vanhanen took on the task in their 2002 book IQ and the Wealth of Nations.3 Since then, Lynn has worked with coauthors to revise, correct, and extend that database; he has been the leading, but not the only, researcher to collect IQ scores across countries.4 I’ll refer to these databases, with due respect to his coauthors, as Lynn’s.
Over the decades, Lynn has made inflammatory statements about average group differences in IQ, but his research is widely cited and given weight in mainstream psychology journals, even by his severest critics. Indeed, one widely discussed study used Lynn’s data to argue that infectious disease holds down average IQs in some countries.5 That study, with its call to raise IQ by fighting disease, was discussed in both The Economist and in the Bill and Melinda Gates Foundation’s 2011 annual report; both The Economist and the Gates report showed graphs with Lynn’s “National Average IQ” on the vertical axis and rates of disease on the horizontal axis.6 Bill Gates himself noted, “Although an IQ test is not a perfect measure, the dramatic effect you see [between national IQ and national disease burdens] is a huge injustice.” Gates’s cautious use of Lynn’s available data offers a good example for researchers: data can be far from perfect and still bring us closer to the truth.
Lynn’s datasets have IQ estimates from over a hundred countries, based on more than one test for the majority of countries. The papers drew mostly from previously published academic studies—sometimes a study of a single typical elementary school classroom, sometimes a comparison of healthy and unhealthy children in the same town, sometimes a study of hundreds or thousands of students or adults. Lynn and his coauthors scoured the literature for relevant studies. The Raven’s visual IQ test was the most common test measure, so cultural references and language issues were less of a concern than they might be otherwise: it puts us closer to Countries X and Y and less like the unfair tests in Countries P and Q. There were usually many IQ estimates for rich or heavily English-speaking countries, while poorer ones were more likely to rely upon one or two studies. Overall, in a country that had multiple IQ test scores the results tended to be similar: the many tests in the United States averaged around 98, the United Kingdom scores averaged slightly higher at 100, Japanese scores tended to be around 105, and so on. Some countries are only represented with noisy, low-quality IQ data, and of course that’s a problem for economic data as well; particularly in the poorest nations economic statistics are often quite inaccurate. But with national average IQ as with national average income per person, multiple perspectives and multiple sources of data can give researchers a useful if incomplete picture of a nation. On this topic, I should also note an important book that does what Lynn did but for a smaller set of countries: Culture and Children’s Intelligence.7 The authors compare the same IQ test—the Wechsler—across about a dozen relatively rich countries. They indeed find that these countries differ slightly in their average IQs and find that more prosperous and better-educated countries tend to have higher scores.
While Lynn’s datasets draw upon academic studies—mostly run by other researchers—those aren’t his only sources. He also uses IQ samples assembled by psychological testing firms: when one of these companies wants to sell its IQ tests in a new country, it’s valuable to have a large sample of test subjects in that country to help “standardize” the test, so school psychologists, prison psychologists, and other mental health professionals can accurately report, “This person is in the 30th percentile/70th percentile/99th percentile in our country.” These standardization samples are often large, perhaps with a thousand test subjects, enough to raise our confidence that a high or low average test score isn’t just a coincidence because the testing expert happened to walk into a particularly strong or particularly weak school that day. The standardization samples tend to yield average scores close to the other scores for the same country, offering some confidence that the smaller studies are generally a good place to start. But of course, the best way to see whether Lynn’s data are reasonably accurate is to compare them against other datasets assembled by researchers—something that’s been done repeatedly in the past decade. We’ll turn to those comparisons later.
One strength of the Lynn databases is that they draw heavily on nonverbal tests, especially the Raven’s. As my own research with Schneider has shown, even if we only use the Raven’s test scores to predict a nation’s economic productivity, even if we throw out all the rest of the data, the relationship between current national average Raven’s IQ and national productivity is quite strong.8 To round out his data, Lynn also draws on some math tests run by international agencies; this is reasonable because, while any one cognitive test might be an imperfect measure of a nation’s current average IQ, combining multiple imperfect measures is more likely to give us a good estimate of average cognitive skill. Get five first-year nursing students to take a person’s blood pressure, and average the score. That average might not be as good as one measure from an experienced nurse. But what you’ll have is far better than no measure at all.
When Lynn and Vanhanen first published their landmark book, much of the media attention focused on minor differences in estimated IQ across Europe: Was Sweden with an estimated average IQ of 101 really smarter than Norway, which tied the United States with an estimated 98? These discussions of quibbles, of two or three IQ points, apparently exasperated Lynn and Vanhanen. Since British IQ is defined with an average of 100—Lynn treats British IQ as the Greenwich Mean Time of global IQ comparisons—and since the IQ range of 85 to 115 points spans roughly two-thirds of the British population, a two- or three-point difference is minor. In their next book they chided readers who obsessed over differences that were more likely a result of measurement error than of real differences in average cognitive skill. IQ scores are, at best, a rough measure of the average mental skills you’re really interested in, just as your semester grade in a course is a rough measure of how well you understand the subject or just as your nation’s reported economic growth statistics are a rough measure of how the economy has been doing. It’s the big differences that we should focus on, and that’s what we’ll focus on here. I’ll start by discussing the region of the world where average IQ scores are currently lowest: Africa south of the Sahara.
Current Average IQ in Sub-Saharan Africa: A Debate Between Psychologists
Let’s begin with a quotation:
There can be little doubt that Africans average lower IQs than do westerners.9
That quote isn’t from Richard Lynn: it’s from a paper coauthored by psychologist Jelte Wicherts, one of Lynn’s leading academic critics. While Wicherts and coauthors noted that test bias might help explain the low scores in sub-Saharan Africa, they also said that health and nutrition improvements, better educational TV shows, and more interactive toys could be part of the path to raising average IQ scores in sub-Saharan Africa.
In a widely discussed set of papers, Wicherts and coauthors set out to systematically critique Lynn’s various estimates of national average IQ in sub-Saharan Africa.10 Indeed, Wicherts and coauthors (henceforth I’ll just refer to Wicherts) did find evidence that Lynn tended to drop or exclude IQ scores from sub-Saharan Africa that were on the high side, studies that Lynn and coauthors often thought were based on elite, unrepresentative test subjects.11 Further, Lynn was likely to include low scores that Wicherts thought were of doubtful quality. Some of the studies in the Lynn database included schoolchildren who were malnourished or ill, sadly a common enough occurrence in this region of the world. One study used by Lynn noted that some children had so little schooling experience they did not know how to use a pencil correctly; a test score from such a child would be as invalid as my IQ score if I took the test in Japanese or Spanish. Lynn and Wicherts went back and forth in a series of articles, critiquing each other’s arguments and choices, and the exchange is valuable for illustrating just how many judgment calls any researcher (or any national government) has to make when assembling a large dataset.
Lynn’s 2002 estimate of current national average IQ in sub-Saharan Africa was 67, well outside the 85 to 115 range that covers two-thirds of the U.K. population. After responding to Wicherts’s critiques and modifying his list of studies, Lynn raised that estimate to 70. That average is far below Lynn’s average for East Asia (106) and well below the average of 100 in the United Kingdom. How big is the average IQ gap between the United Kingdom and the typical country in sub-Saharan Africa, according to Lynn? If you were looking at people within the U.K. population (where the average British citizen is at the 50th percentile) then a score of 70 is at about the 2nd percentile. One can see why Lynn’s claims about average IQ in sub-Saharan Africa provoked such strong revulsion. Surely no nation can have an average set of cognitive skills that low. Can it? And the thought that an entire geographic region could have an average that low seems preposterous on its face.
But what did the apparently more cautious, more careful Wicherts report? He said that the average IQ in sub-Saharan Africa was about 82—corresponding to the 12th percentile in the United Kingdom. That’s an improvement from 70, and it’s an improvement that arose partly because Wicherts chose to throw out samples of students who came from families with nutrition problems and low socioeconomic status. The Wicherts average of 82 only includes samples of apparently healthy students from families that have typical socioeconomic status. And in a region of the world with as much poverty and disease as sub-Saharan Africa, that decision is quite likely to leave out substantial portions of the population.
To further test the data and get the best average, Wicherts wrote a separate paper that looked at only the best test samples—cases with large random samples of a sub-Saharan African nation’s population that weren’t skewed toward or away from highly educated test subjects and in which the test subjects weren’t particularly ill or particularly healthy. When Wicherts threw out every even slightly questionable study, reducing his dataset from dozens of studies to less than ten, what did he find? Did he find clear signs that biased tests and biased data collection were at the heart of the Lynn estimates? Alas, no: Wicherts’s best samples of students have an average (median) IQ score of 76. That’s at the 5th percentile within the United Kingdom.
As a result of the debates between Lynn and Wicherts, we have better cognitive skill estimates that point to a couple of conclusions. First, researchers like myself who long to raise average cognitive skills in the poorest regions of the world up to the levels of East Asia have their work cut out for them. Second, people like myself making comparisons across countries should take account of the possibility that the lowest scores might be inaccurately low. In my own research I’ve typically performed analyses that either “round up” the lowest scores to the Wicherts level or made other statistical adjustments so that the lowest-scoring countries can’t drive the overall results.
And finally, if IQ tests in sub-Saharan Africa are (imperfectly) measuring the same skills that employers seem to value in the rich countries, we would expect current sub-Saharan African workers to be less productive (on average) than workers in the rich countries. The first point is one for public health researchers to take note of; the final point spurs us to look at the link between IQ and wages beyond the rich countries.
What Else Do the Scores Predict?
On this final point there’s already a large academic literature. IQ tests given in poor countries—both in sub-Saharan Africa and elsewhere—predict something quite practical: real-world earning power. Multiple studies run in poor countries find that higher test scores predict higher wages.
Even in rural Pakistan, higher Raven’s IQ predicts higher wages. One might think that thousands of miles away from the Western universities where the tests were designed, abstract IQ tests would have no power to predict which workers earned more and which earned less—but an IQ test made up of boxes and lines and circles had a modest ability to predict a person’s wages across rural Pakistan, just like in the United States.12 And if you ask why the scores can predict wages, you’ll find your way back to the da Vinci Effect: the tendency of people with greater mental skills in one area to be above average in other areas means that people with high Raven’s scores will tend to have better than average memories, better than average arithmetic skills, and better than average verbal comprehension skills. These tendencies, even if they are moderate, mean that high scorers are usually more valuable on the job and are usually able to get into more lucrative lines of work.
The Highest Average IQ Scores in the World: East Asia
In the 1920s and 1930s, psychologists working in Hawaii found that residents of Japanese or Chinese descent tended to have average or perhaps above average IQ; other researchers working around the same time in British Columbia came to similar conclusions.13 Later researchers found that the high scores showed up particularly in visual-spatial tests, with scores on the verbal parts of the IQ tests turning up equal to or slightly lower than average. Since then, the finding has become routine: in populations of East Asian ancestry, whether in China, Japan, South Korea, Taiwan, Hong Kong, or Singapore—or among populations in the United States or Europe whose ancestors came from East Asia—visual-spatial IQ scores tend to be higher on average than those of Western Europeans and their descendants.
Country-level results go back decades. As early as the 1960s, studies in Taiwan and Hong Kong found average IQ scores slightly above the European average. This happened at a time when these countries’ economies were growing fast, but were still poor by U.S. and U.K. standards. Any simple story that “wealth causes IQ” has to account for the puzzlingly high average scores found in Taiwan and Hong Kong decades ago, as well as the high scores found in the poverty-stricken but fast-growing China we all know about today. A healthy environment helps to boost IQ, but it can’t be the whole story. The high average IQs of East Asia and Singapore have yet to be fully explained.
But if full explanation isn’t yet possible, let’s at least take a moment to survey national average test scores in this economically vibrant region. Earl Hunt notes that in the TIMSS math assessment, four of the top five highest-scoring countries are in East Asia, while the fifth is Singapore (although it should be noted that the People’s Republic of China only tested students from prosperous Shanghai), and in the PISA math tests three of the five highest-scoring countries were in East Asia. On PISA reading scores, South Korea was in the global top five, while Japan and Hong Kong were both in the top fifteen. And comparing the average performance of ethnic groups in the United States, Hunt notes, “IQ scores and educational data present a consistent ordering . . . with (northeast) Asians slightly ahead of Whites . . .”14 So both within the United States and around the world, the average cognitive skills of East Asians tend to be quite exceptional. Let’s hope researchers can find practical ways to make those kinds of scores a possibility for every country.
da Vinci Across the Globe?
Does the da Vinci Effect hold up across countries? Do nations with high average math scores also have high average verbal scores and high average IQ scores? Or instead does it all balance out so that strength on one international test usually means weakness in another? Heiner Rindermann ran a variety of statistical tests and the answer was clear: high test scores predict high test scores, and there is a nearly perfect relationship between Lynn’s rough national average IQ estimates and the PISA and TIMSS national average math, science, and reading scores.15 Rindermann and coauthors later combined these scores with the PIRLS literacy test to create a national estimate of what they call “cognitive ability.” Figure 2.1 shows that when combined into a single index, the PISA, TIMSS, and PIRLS scores have a nearly perfect relationship with Lynn’s National Average IQ estimate; these cognitive ability and IQ estimates are also reported in the Data Appendix. It’s worth remembering that even this “nearly perfect” overall relationship still means exceptions for individual countries, particularly among the lower-scoring nations where accurate skill measurement is difficult. The slightly weaker relationship between the separately administered PISA and TIMSS is still robust, as it is between the PISA and the PIRLS, and the same strong relationship holds when one compares a handful of other cross-country cognitive tests. Rindermann finds strong evidence for a da Vinci Effect, a g factor, across countries. A country that displays high cognitive skills in one measured area probably has strong cognitive skills in other measured areas. I’ll draw on this fact repeatedly: for nations, a high average score on one standardized test predicts high scores on others.
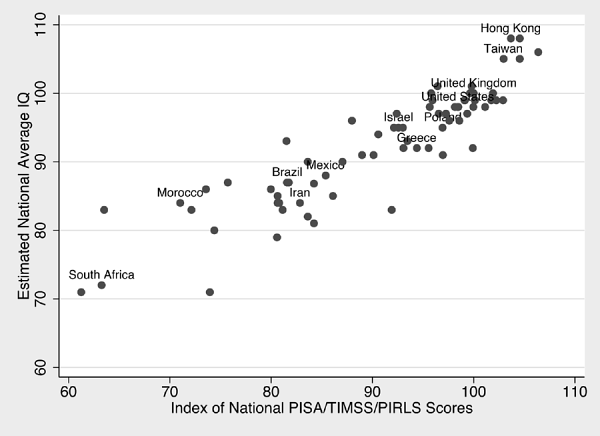
FIGURE 2.1 National average cognitive ability estimated from PISA, TIMSS, and PIRLS exams compared with national average IQ estimates Sources: Rindermann, Sailer, and Thompson, “The Impact of Smart Fractions” and Lynn and Meisenberg, “National IQs calculated.”
Measuring “Unmeasured” Differences in Immigrant Skill
Economists have long wondered why some immigrants to the United States succeed while others fail. Can national average IQ help to explain why? Do immigrants from lower-scoring countries earn less than those from higher-scoring countries? In a project with psychologist Joel Schneider, I addressed these questions. Using economist Lutz Hendricks’s estimate of how much immigrants from different countries earn on average after coming to the United States, Schneider and I checked to see if those from higher-scoring countries earned more than those from lower-scoring countries.16 The answer was an emphatic “Yes, but.” Yes there was a positive relationship, but the relationship was modest: in fact, we found that immigrants from higher-scoring countries earned only slightly more than those from lower-scoring countries. And it looked like the relationship was about the same as in the Wisconsin study of IQ and earnings: one IQ point predicted about 1 percent higher earnings. An average immigrant from a country with an average IQ of 100 (the U.K. average) would earn about 10 percent more than the average immigrant from a country with an average score of 90.
We were also able to see if the result was just because immigrants from different countries tended to arrive with different education levels—Western European immigrants to the United States tend to have more officially measured education, for instance.17 That wasn’t the story: even when we only used the education-adjusted data, so that the only source of wage differences was what Hendricks had called “unmeasured worker skill,” national average IQ still predicted about the same one point for 1 percent earnings difference. National IQ measured some of the unmeasured. So immigrants who arrive from countries with lower average cognitive skills don’t really earn that much less on average, and immigrants from high-skill countries don’t typically earn that much more. At the same time, my project with Schneider showed that the Lynn IQ estimates can predict yet another test score: they can predict how well immigrants do on the market test.